PSPP
PSPP is a program for statistical data processing. It is completely free, with no limitations (licensed under GPLv3). It is developed for the most common operating systems: Windows, Linux, MacOS, and it is portable. Currently, it is in stable version 2.0.0 and actively developed.
It is intended for statisticians, students, as well as anyone involved in quantitative research, primarily in social sciences.
The name of the application is not a clear acronym, but it is reminiscent of the older and more well-known statistics application – SPSS, which is now owned by IBM. The command syntax and data files are fully compatible with SPSS, although the program was developed independently from its famous “relative”. Even the graphical interface is very similar, allowing for an easy transition for SPSS users who may be dissatisfied with the licensing terms.
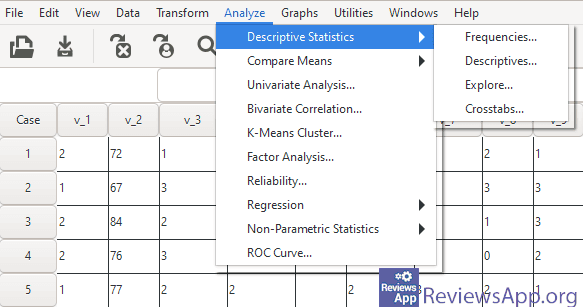
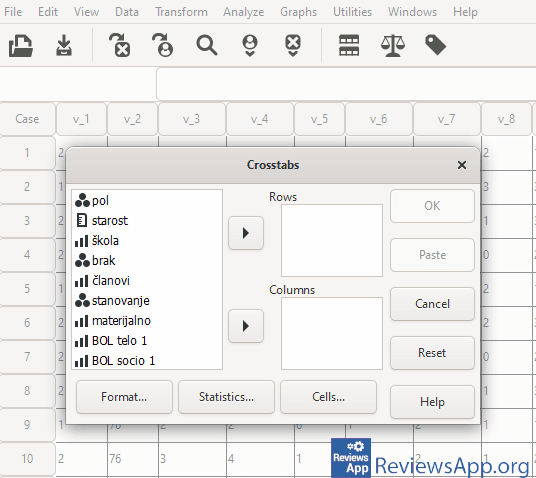
PSPP covers areas that satisfy more than the needs of the average user: descriptive statistics, linear and logistic regression, factor analysis, T-tests, reliability analysis, non-parametric tests… A more detailed list of the tests offered goes beyond the elementary informative purpose of this presentation, so interested readers are directed to the application itself and its documentation.
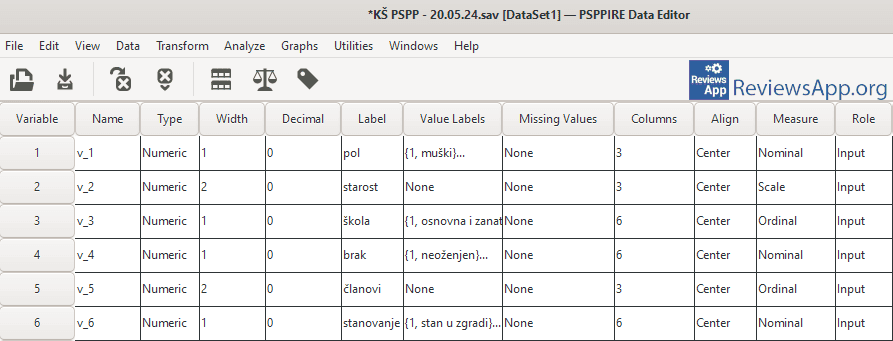
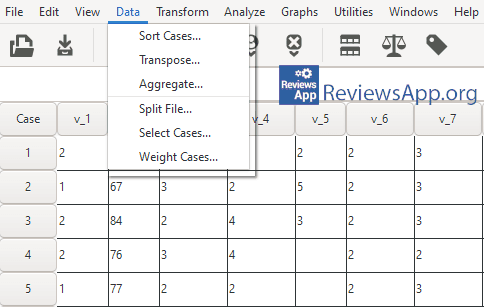
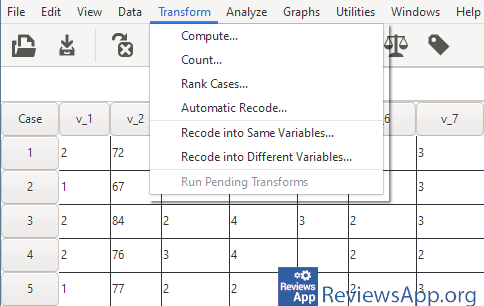
Additionally, PSPP allows for pre-editing of data sets, such as various calculations, recoding, sorting, merging, or splitting into multiple groups.
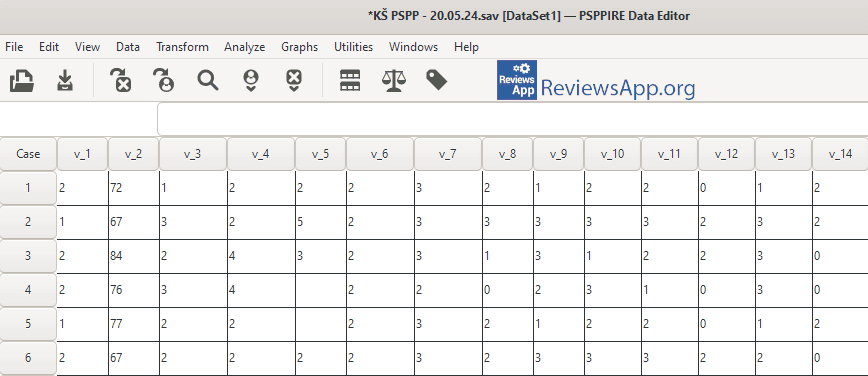
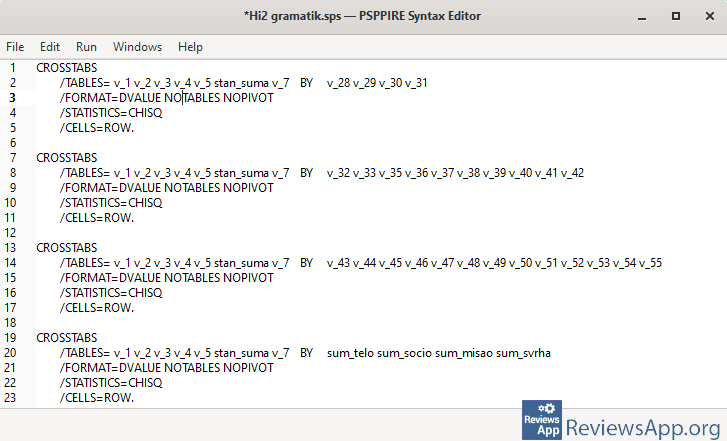
The program operates in a graphical environment or in text mode using its own syntax. It supports working with over a million cases and variables. It is optimized for the fast execution of complex procedures. It is convenient that procedures performed on data can be saved and edited in a text editor with the extension .sps), to be later applied to the same or different data sets. You can work with multiple different files simultaneously.
PSPP imports textual data, as well as data from spreadsheet programs and databases. It supports the most commonly used output formats: pdf, txt, ps (postscript), odt (opendocument), html…
There are also graphical representations of results, but only as a histogram, scatter plot, and bar chart, and at a somewhat reduced level, so exporting data to another statistical or spreadsheet program is recommended for visualization.
The user interface is translated into about ten languages, among which Serbian and related languages are not yet included. In addition to its documentation, you can also use SPSS documentation, which is much more extensive and detailed.
Programs of this kind have very expensive licensing options. Therefore, we suggest trying PSPP: it may fully meet your needs and it’s free.
Platform:
Windows, Linux, MacOS

Rate:
 (No Ratings Yet)