Graphviz Visual Editor – a simple and brilliant graph editor
Graphviz Visual Editor is a free web application for interactive graph editing using Graphviz libraries. Being a web application, it is available to anyone with a computer and an internet browser, regardless of the operating system. This program was created by Magnus Jacobsson from Sweden.
A little theory preceding the Graphviz Visual Editor
Graphs are abstract data structures used to describe various relationships between objects. They consist of two basic elements: nodes and edges. Here, we’ll pause to avoid some terminological ambiguities. Graphs are structures consisting of nodes and edges that represent relationships and structures, while charts are a way of representing quantitative data, usually in a coordinate system, with values entered on the X and Y axes. Here’s another terminological clarification: these terms mean the same – nodes, vertices, points, and elements – as well as edges, branches, and links. We will arbitrarily use the terms nodes and edges.
To better understand graphs, let’s consider an example. There are many ways to represent data. In the world of informatics, the relational approach based on tables is popular. A table consists of rows and columns, where columns usually represent values or attributes, and rows represent entities or items. Conversely, representing data using graphs emphasizes the relationships between elements. Graphs are often a more natural way of working with information, perhaps because of the structure of language itself (subject -> predicate -> object).
Graph theory is a vibrant scientific field where debates about fundamental things are still ongoing. (For example: there are scientists who claim that nodes do not exist, that they are just places where edges touch or intersect!) In parallel with existing statistics based on tabular data, completely separate statistics related to graphs have been developed. For years, there have been many databases primarily working with graphs. All major database programs have support for graphs.
Graphs are used in many areas: transportation organization, project management, web page analysis, process modeling, search algorithms, analysis of social relationships and networks, etc. In the end, depending on the data we want to describe, different models can be applied. If we are making a warehouse inventory list, the tabular approach is probably better. If we are tracking the dynamics of relationships among students in a classroom or communication on a social network, graphs will provide a more quality solution.
Working in Graphviz Visual Editor
Graphviz Visual Editor is based on the Graphviz software library (Graph Visualization Software). This library is also a free and open-source tool for creating graphs and their graphical representations. Graphviz uses the DOT programming language to describe graphs. DOT is essentially a very simple language, and its great power lies in the fact that higher-level programming languages have packages for working with it. In Graphviz, this data is visualized. You can export graphs to PNG, SVG, PDF, and HTML formats using it. Graphviz also has a set of tools for various node arrangement, node and edge formatting, and automatic layout optimization of graph elements.
Graphviz Visual Editor allows you to create new graphs by adding nodes and edges. You can specify and change their attributes (color, thickness, shape, symbol), experiment with the layout of elements on the workspace, zoom in, or move the entire graph for better viewing. Everything you create can be saved in SVG, PNG, and PDF formats or even as interactive HTML graphics.
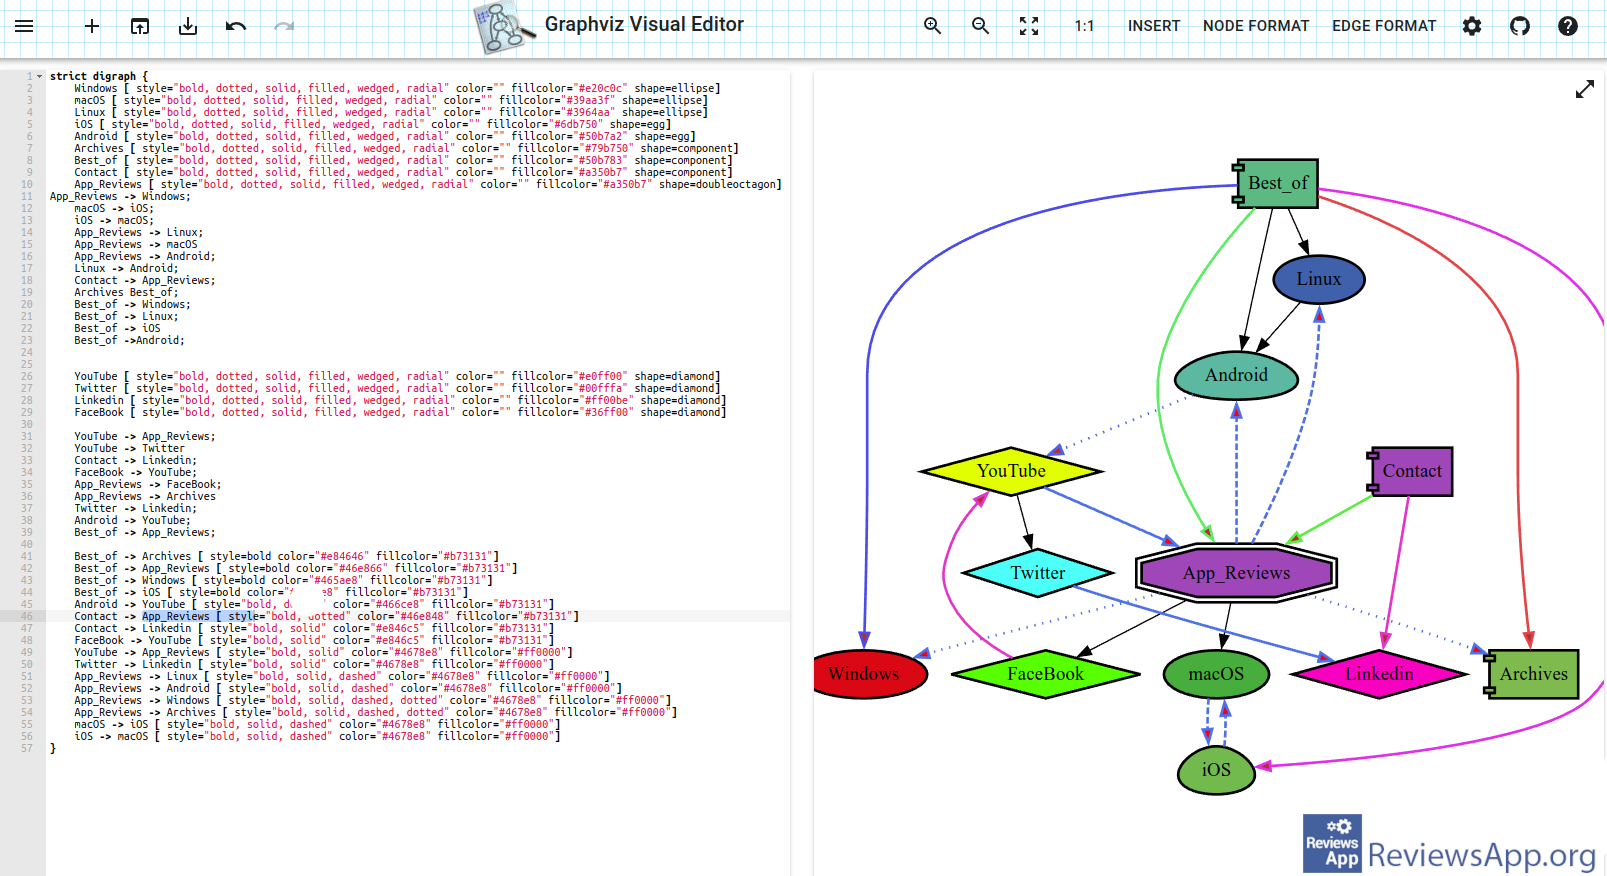
The program environment is simplified to the maximum, so it must be intuitive. On the left side is a text editor where you describe the graph in DOT format. On the right side is the graphical editor where you do the same but in graphical mode using the mouse and Drag and Drop function. Above is a rudimentary menu where you can find some program operation settings, choose the format in which you want to save the graph, libraries of elements to add to the graph, and their formatting. And that’s about it.
The main reason why this program is interesting is that when you enter some DOT code in the text editor (left), it immediately appears in the graphical editor (right). Also, if you make any changes in the graphical editor, the text editor immediately updates it as part of the program code. (Nothing without JavaScript!) Sometimes it is easier to create something in a graphical editor, and sometimes in a text editor. At the same time, this is a very good way to experiment and learn DOT syntax.
Graphviz Visual Editor is suitable for people who prefer a visual approach to work rather than coding. The application of such a program can be very wide. It is convenient for creating diagrams. A graphical editor that updates the program code in real-time is an advantage compared to programs specialized for this purpose, such as yEd. It is often used for studying graphs. You can also use it for mind mapping. Unlike such programs (e.g., Xmind), which are based on a hierarchical model, here you have complete freedom to place elements in any relationships. After all, why always start from just one central idea or concept?
There are other similar web programs as well. Some may find Sketchviz interesting. It is harder to find a similar program for desktop platforms that work well solely for interactive graph editing in both graphical and text modes. Usually, these are just text editors that support the DOT programming language and generate a graph image as the end result. Of course, we have nothing against some larger and more powerful programs for working with graphs, such as Gephi or Cytoscape, but that’s a completely different story.
Graphviz Visual Editor is far from a perfect program. There could be a lot more done on it. Despite its imperfections, it’s simply a brilliant program. Working or experimenting with it resembles playing some addictive game. Beware, it creates addiction!
Platform:
Website

Rate:
 (No Ratings Yet)